CMS专题

多选题Which two chart base types can you select using the Chart Wizard?()ALineBColumnCBubbleDFlowchartEOHLC candle stock

题目
多选题
Which two chart base types can you select using the Chart Wizard?()
A

Line

B

Column

C

Bubble

D

Flowchart

E

OHLC candle stock

如果没有搜索结果,请直接 联系老师 获取答案。
相似问题和答案

第1题:

When navigating in high latitudes and using a chart based on a Lambert conformal projection,______.

A.a straight line drawn on the chart approximates a great circle

B.the chart should not be used outside of the standard parallels

C.the course angle is measured at the mid-longitude of the track line

D.distance cannot be measured directly from the chart


正确答案:A

第2题:

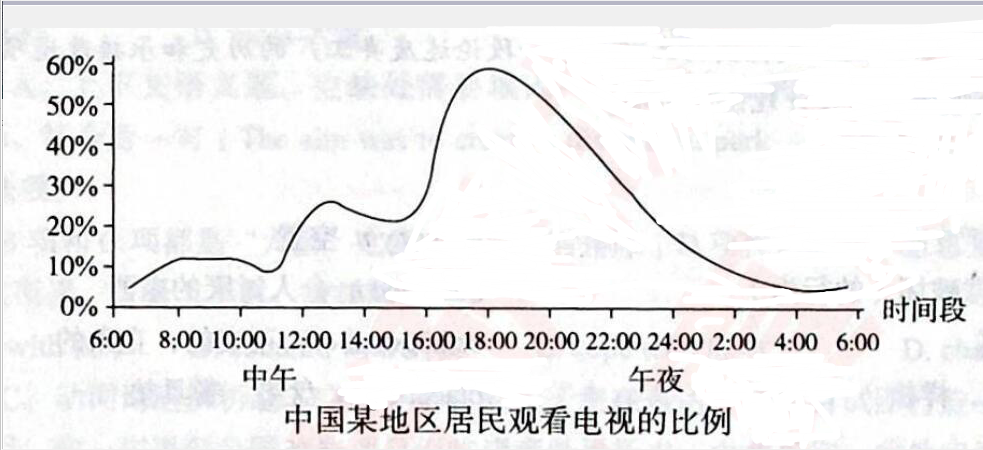
Directions:Write an essay based on the chart below.In your writing,you should interpret the chart,and give your comments.You should write about 150 words on the ANSWER SHEET.


答案:
解析:
The line graph shows audience rating at different time.From the graph,it can be seen clearly that the number of TV audiences is on the rise from 6 a.m.At noon the number of audiences accounts for about 20%of the total population.At 6 p.m.,audience balloons to the peak of the day,reaching approximately 59%,and then the number ofTV audiences drops dramatically.There are several reasons leading to the trend of the audience rating.In the first place,traditional Chinese families would like to get together after dinner,watching news report or other entertainment programmes,therefore 6 p.m.witnesses the highest point of the whole day.Second,the drop of audience rating after 6 p.m.is partly due to the prevalence of Internet.There is a trend that more people resort to virtual space and computer games for entertainment at night.Third,since working people and students are occupied by theirjob sand study at daytime,only retired people and housewives are potential audience.Therefore,audience rating is in accordance with people's pace oflife.Internet has impacted TV audience to some extent.

第3题:

You are asked to configure real-time performance monitoring (RPM) between two Junos devices to track traffic in your network. Which two application traffic types can you track?()

A. ICMP

B. SNMP

C. TCP

D. HTTPS


参考答案:A, C

第4题:

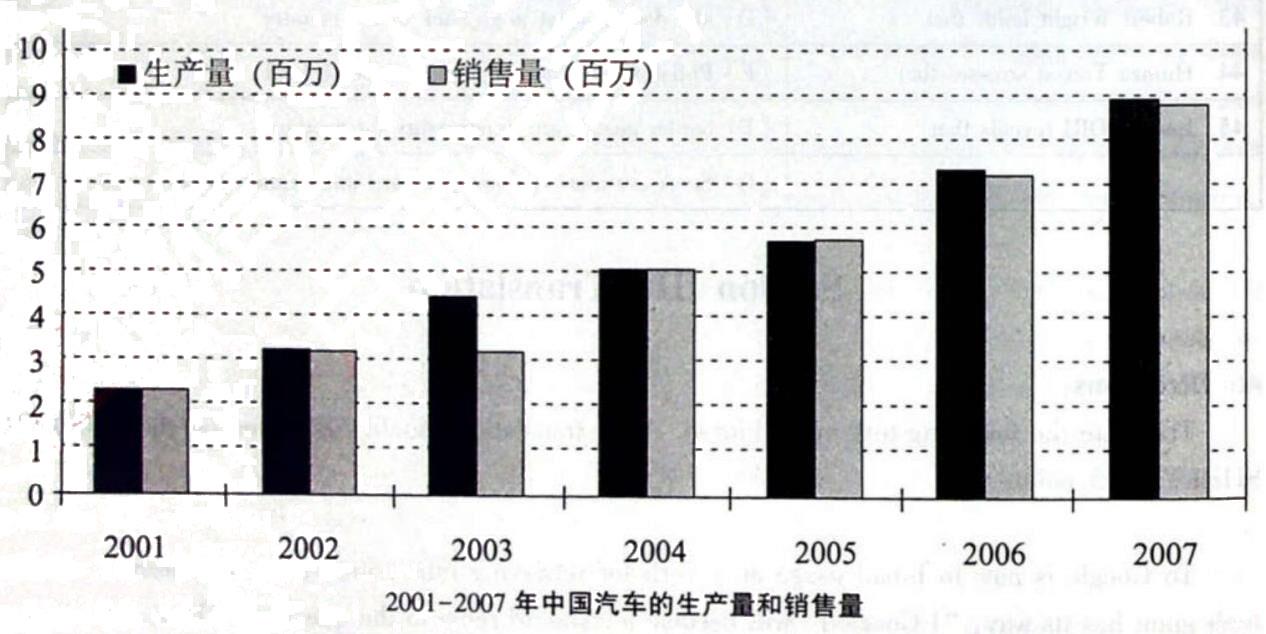
Write an essay hased on che chart below.In your writing,you should interpret the chart,and give your comments.You should write about 150 words neatly on the ANSWER SHEET.


答案:
解析:
Chin8 s Automobile Market Grows Rapidly According to the table above,the auiomobile production sales in China amounted to over 8 million in 2007,with an average annual growth of more than 22qo from 2001 t0 2007.This means that after less tban one decade of development,China has emerged into the world's fastesl-growing major auto market.There are two main reasons for the increase.For one thing,since general market-onented reforms were introduced in China around 30 years ago.restrictions and controls on the automobile sector have been gradually eased,resulting in the joint venture partnerships with major global automobile manufacturers.For another,thanks to Lhe burgeoning economy,the disposable income of Chinese cithens has maintained an upward trend for years,contributing to an increasing number of people owning private vehicles.Despite the breakneck growth over the past decade,China's auto market still has much room Lo grow before reaching saturation and the prospects for China's auto market remain bright.

第5题:

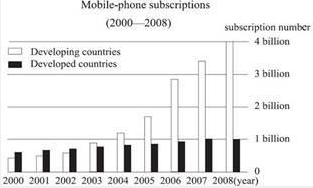
In this section, you are asked to write an essay based on the following chart. In your writing, you should interpret the chart, and give your comments. You should write at least 150 words. Write your essay on the ANSWER SHEET 2.


答案:
解析:
This bar chart shows mobilephone subscriptions in developing countries and developed countries,measured in billions,for the years 2000 to 2008.The mobilephone subscriptions in both developing countries and developed countries enjoyed increase in different speed over time.In this chart,the mobilephone subscription in developed countries maintained a continual and steady increase from 2000 to 2007 and remained constant in 2008.Meanwhile,the mobilephone subscription in developing countries have undergone a slow increase from 2000 to 2004 and then saw a great surge from 2005 to 2007.This trend increased to a peak about 4 billion in 2008.Based on different national situations,the reasons leading to this trend can be summarized into two points.First,the developed countries have a limited number of population,which decides that the demand for mobilephone service is also limited and will soon be saturated.Second,as for the developing countries,it has a large population and also a large demand for mobilephone service.And as the mobilephone becomes more available and more affordable,there is an increasing number of people buying their mobilephones.In my view,this trend that the number of mobilephone subscription continues to grow in developing countries will be constant for a while in the future.And this trend would also benefit most of the mobile users both in the developing countries and developed countries.

第6题:

In which source could you find the number of a chart for a certain geographic area? ______.

A.Chart No. 1

B.Catalog of Charts

C.IMO Practical Navigator

D.IMO Light List


正确答案:B

第7题:

Write an essay based on the following chart.In your writing,You should interpret the chart,and give your comments.You should write about 150 words on the ANSWER SHEET.


答案:
解析:
From the graph,we can clearly witness that the urban population was ascending while the rural population was declining during 1990 to 2010.The number of the urban citizens rose from 300 million in 1990 to about 460 million in 2000,and to about 685 million in 2010,while the rural peopledescended from about 820 million in 1990 to 800 million in 2000 and to 690million in 2010.It's apparent that in the past two decades,the urbanpopulation witnessed a steady growth,but in the latter decade,the rural population had a remarkable shrinkage.Personally,there are two main reasons for this phenomenon.On one hand,the economic boom led to the regular improvement of people sliving standard,and further resulted in a steady growing urban labor force.On the other hand,from 2000 the countryside urbanization oriented by the government gave rise to a conspicuously declining of rural labor force.In conclusion,based on the analysis above,the increase of urban quantity of citizen will be going on,while the rural population will continue to drop in the future,which is the need and trend of china's urbanization process.

第8题:

The revision date of a chart is printed on which area of the chart?

A.Top center

B.Lower-left corner

C.Part of the chart title

D.Any clear area around the neat line


正确答案:B

第9题:

Directions:Write an essay based on the chart below.In your writing,you should 1)interpret the chart,and 2)give your comments.You should write about 150 words on the ANSWER SHEET.


答案:
解析:
The pie chart given above reflects the public's attitude towards food safety.According to the figures,44.7%of the people take neutral attitude towards food safety,ranking first.The percentage of consumers being a little worried about food safety ranks the third among all.making up t 5.8%.There is no denying that food safety is related to people's health and basic livelihood.However,many producers tend to adopt poor-quality raw materials to lower costs,resulting in poor-quality products prevailing in our society,which not only poses threats to people's health,bul also wreaks havoc(破坏)on the economic development and social stability.Particularly,when the authorities concerned fail to give direct control and supervision,these profit-driven companies are unlikely to shoulder social responsibility.To conclude,such a trend will probably develop more dramatically in the future.Therefore,it is advised that administrators and the authorities should keep taking measures to reverse such trend,and it is only by consistent and persistent efforts that they can ultimately eliminate the misdeeds.

第10题:

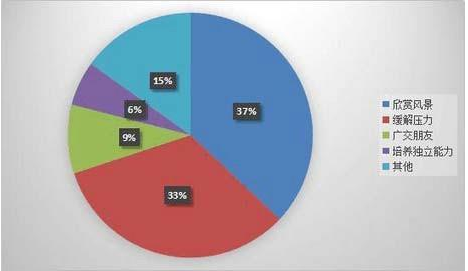
Write an essay based on the following chart.you should interpret the chart and give your comments.You should write about 150 words on the ANSWER SHEET.


答案:
解析:
Portrayed in the above pie chart is a survey of college students'purposes of traveling。The number of students who take traveling as a chance to see beautiful scenes accounts for 37%,while students who would like to travell relieve pressure fr om study.

更多相关问题