海船船员

The chart you supplied was anything ______ up to date.A.butB.exceptC.besideD.apart from

题目

The chart you supplied was anything ______ up to date.

A.but

B.except

C.beside

D.apart from

如果没有搜索结果,请直接 联系老师 获取答案。
相似问题和答案

第1题:

You are setting up a Junos Pulse Access Control Service. You cannot obtain a device certificate from an external certificate authority.Which tool should you use to generate a device certificate?()

A.OpenSSL

B.OpenSSH

C.OpenLDAP

D.OpenRADIUS


参考答案:A

第2题:

You are docking a vessel in a slip which has its entrance athwart the tide.You land the ship across the end of the pier,stemming the tide,preparatory to breaking the ship around the corner.You have one tug to assist.Where would you generally tie up the tug ________.

A.Have her on a hawser from the stern

B.Tie her up on the inshore bow to hold the ship off the end

C.Tie her up on the offshore bow

D.Tie her up on the inshore quarter to lift the stern


正确答案:C

第3题:

“Now, Chip, I won't have you making up such wild stories. ”is a line from().

A、Santa

B、his Mom

C、his Dad

D、theConductor


参考答案:A

第4题:

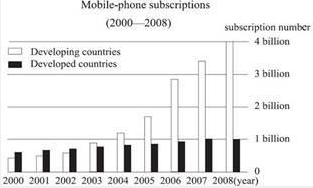
In this section, you are asked to write an essay based on the following chart. In your writing, you should interpret the chart, and give your comments. You should write at least 150 words. Write your essay on the ANSWER SHEET 2.


答案:
解析:
This bar chart shows mobilephone subscriptions in developing countries and developed countries,measured in billions,for the years 2000 to 2008.The mobilephone subscriptions in both developing countries and developed countries enjoyed increase in different speed over time.In this chart,the mobilephone subscription in developed countries maintained a continual and steady increase from 2000 to 2007 and remained constant in 2008.Meanwhile,the mobilephone subscription in developing countries have undergone a slow increase from 2000 to 2004 and then saw a great surge from 2005 to 2007.This trend increased to a peak about 4 billion in 2008.Based on different national situations,the reasons leading to this trend can be summarized into two points.First,the developed countries have a limited number of population,which decides that the demand for mobilephone service is also limited and will soon be saturated.Second,as for the developing countries,it has a large population and also a large demand for mobilephone service.And as the mobilephone becomes more available and more affordable,there is an increasing number of people buying their mobilephones.In my view,this trend that the number of mobilephone subscription continues to grow in developing countries will be constant for a while in the future.And this trend would also benefit most of the mobile users both in the developing countries and developed countries.

第5题:

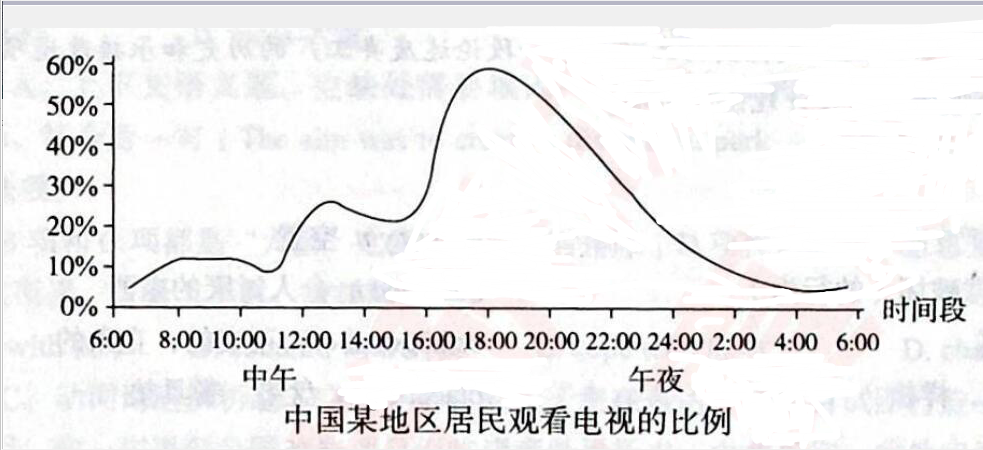
Directions:Write an essay based on the chart below.In your writing,you should interpret the chart,and give your comments.You should write about 150 words on the ANSWER SHEET.


答案:
解析:
The line graph shows audience rating at different time.From the graph,it can be seen clearly that the number of TV audiences is on the rise from 6 a.m.At noon the number of audiences accounts for about 20%of the total population.At 6 p.m.,audience balloons to the peak of the day,reaching approximately 59%,and then the number ofTV audiences drops dramatically.There are several reasons leading to the trend of the audience rating.In the first place,traditional Chinese families would like to get together after dinner,watching news report or other entertainment programmes,therefore 6 p.m.witnesses the highest point of the whole day.Second,the drop of audience rating after 6 p.m.is partly due to the prevalence of Internet.There is a trend that more people resort to virtual space and computer games for entertainment at night.Third,since working people and students are occupied by theirjob sand study at daytime,only retired people and housewives are potential audience.Therefore,audience rating is in accordance with people's pace oflife.Internet has impacted TV audience to some extent.

第6题:

To agree with larger scale chart,latitudes taken from this chart should be increased ______ about 8 seconds.

A.with

B.in

C.by

D.to


正确答案:C

第7题:

Chart depth is the ______.

A.vertical distance from the chart sounding datum to the ocean bottom, plus the height of tide

B.vertical distance from the chart sounding datum to the ocean bottom

C.average height of water over a specified period of time

D.average height of all low waters at a place


正确答案:B
海图标注水深是自海图图深基准面到海底的垂直距离。

第8题:

Tom:Kate,you are back from vacation! How was it?

Kate: To tell you the truth, I feel tired.

Tom: _________?

Kate: I had to visit all my relatives.

A. Anything special

B. Why not

C. What's hurry

D. How come


正确答案:D
Tom问Kate的假期如何时,Kate的回答是:“我感觉挺累的。”选项D(怎么会呢?)符合语境,选项A(发生了什么意外吗?),选项B(为什么不?),选项C(急什么?),均不符合题意。

第9题:

Write an essay based on the following chart.In your writing,You should interpret the chart,and give your comments.You should write about 150 words on the ANSWER SHEET.


答案:
解析:
From the graph,we can clearly witness that the urban population was ascending while the rural population was declining during 1990 to 2010.The number of the urban citizens rose from 300 million in 1990 to about 460 million in 2000,and to about 685 million in 2010,while the rural peopledescended from about 820 million in 1990 to 800 million in 2000 and to 690million in 2010.It's apparent that in the past two decades,the urbanpopulation witnessed a steady growth,but in the latter decade,the rural population had a remarkable shrinkage.Personally,there are two main reasons for this phenomenon.On one hand,the economic boom led to the regular improvement of people sliving standard,and further resulted in a steady growing urban labor force.On the other hand,from 2000 the countryside urbanization oriented by the government gave rise to a conspicuously declining of rural labor force.In conclusion,based on the analysis above,the increase of urban quantity of citizen will be going on,while the rural population will continue to drop in the future,which is the need and trend of china's urbanization process.

第10题:

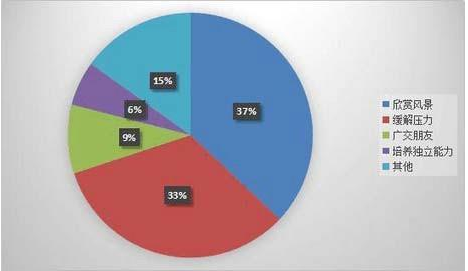
Write an essay based on the following chart.you should interpret the chart and give your comments.You should write about 150 words on the ANSWER SHEET.


答案:
解析:
Portrayed in the above pie chart is a survey of college students'purposes of traveling。The number of students who take traveling as a chance to see beautiful scenes accounts for 37%,while students who would like to travell relieve pressure fr om study.

更多相关问题